
There is an email circulating around the internet titled "In Just One Year." In it the author states that, when democrats took office in 2006, the price of gasoline was $2.19 a gallon. The implication is that the democrats caused the price of gas to go up.
Anyone who has to fill up a gas tank knows that the price of gasoline has gone up, but it has been going up since long before the democrats took control of congress. The Bureau of Labor Statistics has a handy chart showing the rise in gas prices since 1998. (You may have to scroll down a bit on the page.) Note that the average price of gasoline in 1996 was actually around $2.80, not $2.19 as the author of the email claims.
Demand for Oil is Growing, But Supply is Limited and Precarious
The U.S. uses more than 20 million barrels of oil per day, the majority of which is imported (see this handy CIA factbook chart). The next highest consumer is the European union. While we have 40% less population than the EU we use 30% more oil. China and India use only a fraction of what we do (7 million and 2.5 million barrels respectively), but their use has been increasing steadily. China's oil needs are growing by 4% a year, fueling oil speculation and even Chinese bids for U.S. oil companies (see this article from NPR).
No one knows for sure how much oil there is left or how long our supply can meet the growing demand. According to the Organization of the Petroleum Exporting Countries (OPEC), there were 1,204,182 million barrels of oil reserves as of the end of 2007. But OPEC figures are not audited and, although oil is being taken out of the ground, the reserve estimates remain the same year after year. Moreover, estimates don't necessarily differentiate between oil that can be extracted using present technology, at a reasonable cost, and oil which may be too expensive or difficult to extract.
Whether or not the OPEC figure is correct, we have always known that the supply of oil is finite. This shouldn't come as a great shock to anyone. The Federal Trade Commission started warning us in 1923 that the supply of U.S. oil was being rapidly depleted. In 1943, former Secretary of the Interior Harold Ickes published an article titled "We're running out of Oil!" And in 1956, a geoscientist by the name of Marion King Hubbert calculated that the United States would reach peak oil sometime between the late 1960s or early 1970s. His prediction proved true. U.S. oil production did peak in the 1970s and has been declining steadily (see this chart from The Heritage Foundation). Scientists have been using Hubbert's Curve to predict peak oil worldwide. According to the curve, we are reaching worldwide peak oil right about now.
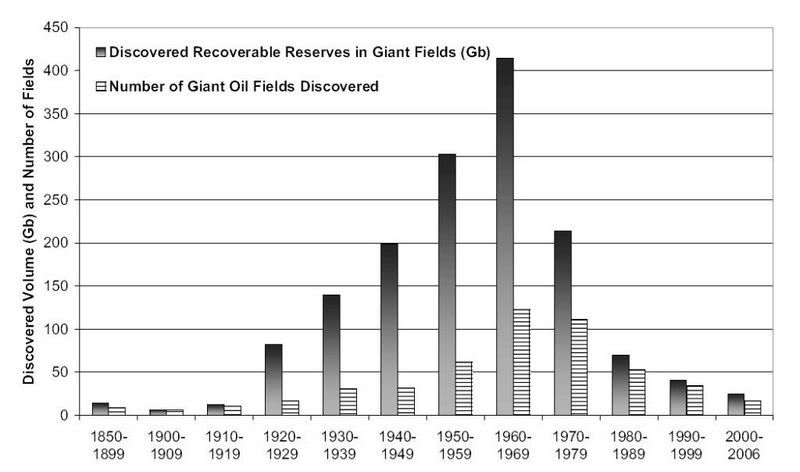
While no one can yet say with certainty whether or not we have hit peak oil, there are a few things we do know for certain. Oil discoveries have been decreasing steadily since the 1960s. See this handy graph published on The Oil Drum for a visual. We also know that oil production has been stagnant since 2005. Many blame the stagnation on the fact that several of the largest oil fields seem to be in decline. Another reason is lack of refinery capacity. We haven't built a new oil refinery in the United States since 1976. And while refiners have been able to squeeze more and more production out of current facilities, they are running near maximum capacity. (See this article from MSNBC)
Then there are the problems of extraction. Much of the oil that is left is more difficult to extract and produce. It may surprise some of you to know that Canada is our top supplier of crude (see figures on crude imports from the Energy Information Administration). Unfortunately, the biggest reservoir of oil in Canada is in the form of "heavy crude" which is a sandy, sludgy mess that is costlier to extract than lighter versions. (Wired Magazine has an interesting article about it here.) While companies have been able to improve extraction techniques, higher costs to produce will undoubtedly mean higher costs to use.
Transportation shortages and shutdowns have been a problem as well. In 2004, the New York Times ran an article about the shortage of oil tankers and the higher fees companies are having to pay to move their oil around the world. There have also been pipeline problems. In 2006, congress held hearings about a major shutdown of the Alaska Pipeline (a shutdown which led to a spike in gas prices). While the Alaskan shutdown seems to have been human error, other shutdowns have been deliberate. The blowing up of an Iraqi pipeline sent prices upward in March, see article here. Another pipeline attack in Nigeria just occurred this month. On top of which, acts of nature can cause shutdowns and send prices soaring. Gas prices shot up after Katrina, which damaged several refineries. Even less severe storms, like the recent Dolly, will cause production to drop.
Oil is Big Business and Highly Speculative
Profits in the oil business are enormous. Three of the top five Fortune 500 companies of 2008 are oil companies
1. Wal-Mart
2. Exxon Mobil
3. Chevron
4. General Motors
5. ConocoPhillips
In 2007, Exxon made $40.61 billion net profit. To put that in perspective for you, that is double the 2007 budget for the U.S. Department of Energy and about 60% of the U.S. Department of Education budget for the year (sans loans). And lest you think all that profit is going right back into exploration and infrastructure, let me assure you that the employees of these companies are doing just fine. Lee Raymond received $48.5 million the year before he retired from Exxon. And while pensions for most of us shlubs are becoming a quaint thing of ancient history, Raymond was eligible for a pension valued at $98.4 million.
Incredibly, that's not even where the real money is. If you want the fattest CEO salary, it is all about working for a global investment firm like Goldman Sachs. Four of the 25 most highly paid male executives work for Goldman Sachs Group, each bringing in $40 to $50 million in 2006. Goldman Sachs just so happens to be heavily invested in energy markets. Many believe that the kind of speculative investing that Goldman Sachs does is actually what is causing the bulk of the rise in energy costs. F. William Engdahl blames as much as 60% of the rise in oil prices to speculators. You can read his article, which has a detailed explanation of the oil market here.
Oil was always a crap shoot investment. If you drilled and came up with nothing, you were out a huge chunk of change. The speculation centered on whether or not you would find oil. In 1983, a futures market for oil opened up. Now speculators were guessing, not on whether or not oil would be found, but on how much the price of a barrel of oil was going to be. A firm like Goldman Sachs can buy a future guaranteeing them a set price and, if the price of oil goes up, they get to buy it at the promised cheaper price and resell the paper at a huge profit.
Not surprisingly, Goldman Sachs keeps on predicting higher crude prices. Of course, the higher prices they predict, the more investors run to buy. The more investors run to buy, the higher our gas prices go. While there has been some (barely discernible) talk in congress about ending this speculative frenzy, so far they have done nothing.
The Effect of War on Oil and of Oil on War
Oil prices and availability have always been effected by war. In 1899, they shot up during the Boer War in South Africa and in 1905 because of the Russo Japanese war. German destruction of U.S. oil tankers during World War I led to the complete banning of any pleasure driving in England and to the appointment of the first energy czar in the U.S. World War II saw strict oil rationing, even in the then oil rich United States. Quite simply, war uses a lot of oil. In fact, the U.S. military is the largest oil consumer in the world.
In the case of our current war, the oil factor is even more acute. Our war is being fought on top of the fourth largest oil reserve in the world. The war shut down oil production in Iraq and it still has not recovered. Of course, there are many people who believe oil was a factor (if not the factor) driving the war to begin with. I won't go into the arguments here, as the case has been laid out in many places. I'll just point you towards a few articles.
- A Crude Case For War? - A Washington Post article outlining the present theories.
- It's the Oil, Stupid - An article by Noam Chomsky
- Why the "9/11 Truth" movement makes the "Left Behind" sci-fi series read like Shakespeare - A hilarious article by Matt Taibbi making fun of 9/11 truthers (those people who think Bush and Cheney planned the 9/11 attacks.)
In short, the nation with the largest and most secure oil supply has the advantage. Given that fact, not to mention our dependence on oil for everything from food production to home heating, wouldn't it be absurd for a U.S. leader not to take oil into consideration when making decisions about war?
So Why is the Price of Gas so High and Who is to Blame?
The essential problem is basic supply and demand. The supply is only getting smaller and the demand is only getting bigger. The volatile political situation in the areas where much of the oil is located doesn't help. Neither does the greedfest fueled by Wall Street speculators. The fact that the value of the U.S. dollar has been steadily declining isn't making things any easier. Our insatiable appetite for energy wasting McMansions and gas guzzling SUVs isn't helping much either. And factoring in the environmental costs of burning fossil fuels isn't likely to make things any cheaper.
Ultimately, we all have to take some of the blame. In 1973, Nixon delivered the first presidential address on energy and called for an Apollo type program for energy independence. James Schlesinger, who worked in the Carter administration, tried to come up with a plan to wean us off oil and promote conservation, but we didn't listen. Instead of learning lessons from the gas crises of the 1970s, we continued to operate for 35 years as though oil would last forever. Even as recently as 2006, our government was cutting funding for research into renewable energy. We could blame the various administrations (democrat and republican) for this fiasco, but most of us weren't exactly clamoring for more responsible policies.
Reference
Yergin, Daniel. 1991. The Prize: The Epic Quest for Oil, Money & Power. New York: Free Press.


